Last year, I sketched out why downtown has so many huge parking plinths. But another world is possible! Today, we’ll check out alternatives to the plinth. Then, coming soon, we’ll have a look at how regulations could finally #parktheplinth.

Last year, I sketched out why downtown has so many huge parking plinths. But another world is possible! Today, we’ll check out alternatives to the plinth. Then, coming soon, we’ll have a look at how regulations could finally #parktheplinth.
Coming up on Thursday, the 2019 version of the Austin City Council will start deliberating on one of the biggest decisions of this year: where to go now that CodeNEXT is dead. City Manager Spencer Cronk asked for direction from City Council on five questions, including how much we should allow “missing middle” housing (think: small multi-unit buildings like triple deckers or four-plexes). This kind of missing middle housing could make a tremendous difference in improving housing in Austin. Here’s six reasons why.
Economic development incentive deals — tax breaks to companies for bringing jobs to a city — have had a pretty bad run of news in Austin and beyond. Amazon’s HQ2 headquarters search earned a mile of negative attention for every inch of excitement even before they gave up on a deal with New York.
In Austin, economic development deals have been controversial for a while.
In an age of polarizing issues, there has been perhaps no issue more polarizing than the deployment of shared dockless scooters. Any news article or twitter mention of them rapidly fills up with tales of people’s hatred and love for the little rideable devices. The lovers — myself very much included — sometimes (always) like to deflect from the problems with scooters by making detailed thoughtful arguments (snarky memes) about how they’re at least better than cars.
But not today. Scooters are fun, green, dangerous, revolutionary, annoying, fantastic obstacles. The benefits are real and the problems are real. Today I’ll take a look at the downsides — and how we could fix them:
Continue readingCity of Austin staff are in the process of putting together a grand strategy for transportation. These kinds of documents can range from foundational texts that set the stage for city-wide transformations to activist flypaper that channel interested citizens’ attention away from the political process that bring change and toward the construction of very expensive paperweights. This one has the potential to be transformational but in its draft state, it falls quite a bit short.
First, the good. It touches on a number of issues that are huge problems:
With all these improvements, this could be a transformational document. But strangely for a strategy document, it doesn’t do a ton of actual setting of strategies. Let’s go back to the issue with fire trucks. This is how the draft policy reads:
Manage public safety needs supported by the transportation network including street safety, emergency response, flood risk, disaster resiliency, and public health for the best outcome.
This is an improvement over the existing unstated policy where we don’t even recognize the tradeoffs. But recognizing tradeoffs isn’t a strategy for managing them! Here’s my version:
Wide streets have significant downsides due to impervious cover, maintenance costs, heat island effects, encouraging dangerous driving speeds, and discouraging pedestrian connectivity. Align the transportation criteria manual, emergency response vehicles, and other city resources toward a goal of narrower, safer, streets.
This isn’t super detailed. What’s narrow in one situation may be wide in another. But it sets up a broad goal and strategy toward achieving that goal. The next time the city purchases fire trucks, writes its street design manual, or has any other tradeoff question, staff will have a clear directive on what kind of outcomes they should be going for.
This is only one policy point in one subchapter. But the same is true of the document writ large. Sometimes I summarize documents I’m writing into a single sentence, losing vital detail but gaining insight into broader themes. My summary of this transportation strategy right now is “Improve all transportation modes.” Just like with the fire trucks, this represents a real improvement over the status quo where private cars are prioritized by default with other modes accepted only in exceptional circumstances. But while it elevates other goals beside automobile throughput, it doesn’t provide much of an actual policy or strategy for choosing between these goals except in very narrow circumstances.
Here’s my updated version:
Improve mobility, safety, and environmental outcomes by substituting other transportation modes for car trips where possible.
The document as a whole wouldn’t have to change that much as it already contains many good strategies in the sidewalk, public transportation, land use, and bicycling sections that could be useful for achieving such a substitution. But it would require adding sections that explain how to resolve conflicts between different goals. For example, the first strategy when a street has maximized vehicle throughput shouldn’t be to widen streets but to find ways to get more people per vehicle.
The deadline for public comment on the document is January 13! Please add your comments!
Austin’s new city council is shaping up to be the most development-friendly Council in recent memory. What kind of agenda could we expect or hope to see from the new City Council? Here’s what’s on my holiday wishlist.
CodeNEXT is dead. One reason it failed is that it combined two separate but related goals: increasing density and improving design. How dense different parts of Austin should be is a subject of intense debate. By contrast, the best ways to design Austin given a certain level of density is debated mostly by professionals. To the extent that the public debated design elements at all, the arguments sounded an awful lot like the only thing most people cared about is how these design elements affect yield. Looked at it this way, CodeNEXT was doomed to fail. It’s impossible to write coherent design guidelines when the public takes intense interest in them but evaluates them solely based on how much housing (or other buildings) they produce.
We must at least try to separate the issues of density and design. Improving the presentation of the code, the process of getting building permits, improving our streetscapes; all important issues that need a collaborative process informed by technical know-how. On the other hand, the question of whether we build a city that sprawls outward or soars upward is one with a lot of public input from the kinds of people who vote in municipal elections. It’s a question that has divided the electorate to the point of dividing communities like environmental groups and neighborhood associations. This is not an issue we can hope to just keep talking about until we find common principles. We don’t need to be nasty in how we debate the issue but we need to recognize that dumping these political questions on to staff and community engagement is doing more to cause rifts than heal them, without providing meaningful benefit. So, for my Christmas wishlist, I hope that our City Council takes a bold leap of faith and does the job they were elected to: settle political issues. That means making real movements on density even without the comfort of a completely undivided city. My real wish here is that come next Christmas, Austin can stop debating whether we are a place that welcomes new residents and start moving on to debating how we welcome new residents.
How could we do that? Here are some ideas:
Austin has seen a number of new apartments (usually built on top of new shops or restaurants) on commercial streets like Burnet, Lamar (North and South), and South Congress since it first started allowing such buildings in 2004. They’re not my personal favorite housing style; I prefer to live on side streets with less traffic noise and pollution. But there’s no doubt that they’ve been a very popular type of new housing. They produce new homes for a lot of people who need them and they’re very easy to serve by transit, as streets with shops are already our most common bus routes. The new buildings are required to follow design guidelines that make the city more walkable, by doing things like limiting the number of driveways that interrupt sidewalks.
Here are three items on my wishlist to build on the VMU program’s success:
Self-guided walking tour of Ballard, one of Seattle's urban villages. Here's a conventional grocery store tucked under apartments, wrapped around parking. pic.twitter.com/dKEcyG6Acg
— Dan Keshet (@DanKeshet) September 4, 2018
“Missing middle” is the idea that there’s not a lot of ways to live in Austin that fall between a house surrounded by yard on all sides and an apartment complex with a leasing center with little bowls of candy in the waiting room. In other cities, you get lots of housing types in between: triple-deckers in Boston, greystones with up to 6 apartments in Chicago, or row houses in virtually every city the entire world over. Missing middle housing types can be employed on busy commercial streets; many cities have rowhouses interspersed with shops. But it really shines as a way of allowing more people to live on the calmer, quieter side streets where adults and children both are safer walking.
Redesigning Austin around missing middle housing is going to take a lot of work. We have effectively destroyed so much of our missing middle heritage that Austin’s Historic Preservation Officer proposed landmarking a fourplex as a rare example of a bygone housing type. But there are some items on my Christmas wishlist that are ready to ship today:

Requiring that every house, apartment, store, school, daycare, and bar have its own parking places is crazy stupid. It encourages people to get an extra car even if they could get by without it, it adds crazy large expenses to everything we build, and it makes the city ugly as heck. Once you realize how much of a city is built the way it is just to provide huge amounts of parking, you’ll feel like you’ve just put on the goggles from They Live:
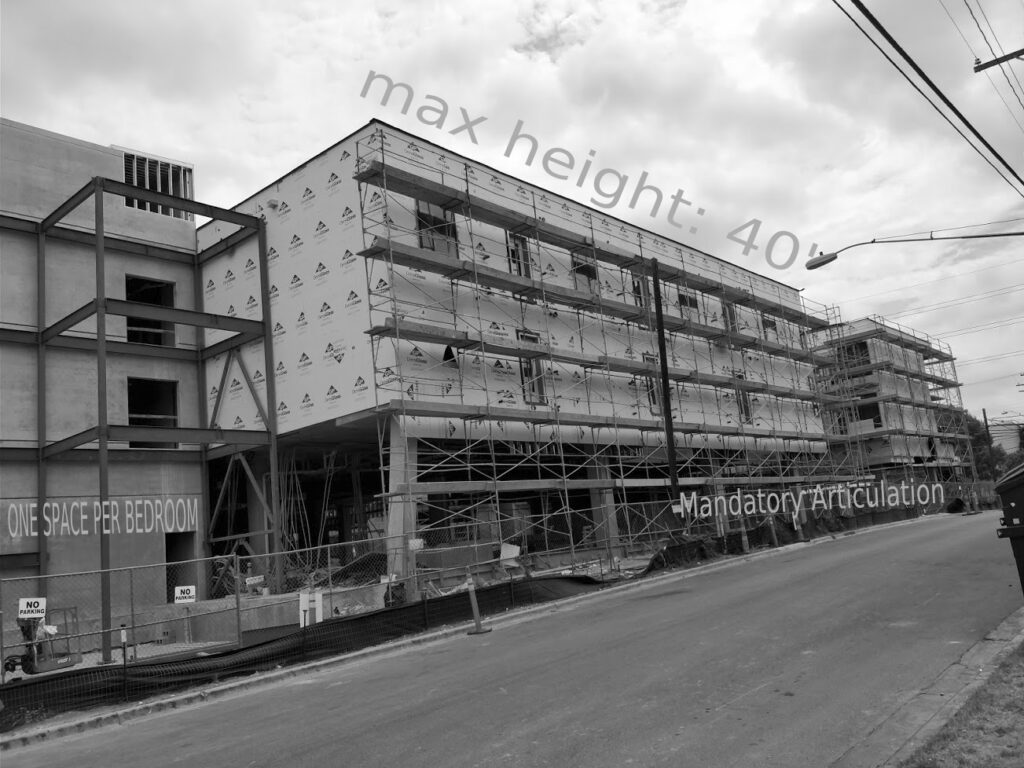
Parking requirements aren’t one of those “we just disagree on the right amount” ideas. They’re always wrong and the best thing we can do is eliminate them entirely. But if that isn’t on the shelf at the mall, some good alternatives could be:
The downtown/UT campus area is a special place, different from any other part of Austin and in some ways any other part of Texas. Austin has one of the largest percentages of jobs in its central business district, understood in this case to extend all the way up to UT. Although this can cause problems with car traffic when many people commute in from around the city surrounded by their steel cages, it’s a huge advantage for running transit. These areas are both doing very well but threatening to run out of room as they get built up. So what would I love to get to fix this?
Design and density go best together. A comprehensive rewrite of our land development code could be far easier to achieve once the Council has set the policy direction clearly. But no matter what, it’s going to be a long process. When CodeNEXT died, many people from within the development and homebuilding industries actually let out a sigh of relief as they felt many of the areas outside the public interest weren’t well-enough examined. Outside of the pressure cooker of setting the city’s direction on density, real progress can be made on the more technical aspects of the code. Let’s start.
With the completion of the runoffs, Austin’s next City Council is set. Although it falls short of the densificatron the Austin Chronicle mused about, it is being widely hailed as the most urbanist-friendly council in recent memory. How did we get here? Well, I’d like to believe it’s because the world is coming to understand that building awesome, compact cities is the only way for humans to prevent catastrophic global climate change. In fact, I do believe that. But there’s also some structural, political reasons. Let’s listicle.
1) Higher turn-out elections
It’s no secret low-turnout elections favor Republicans and development skeptics. In 2016, development-friendly candidate Sheri Gallo led development-skeptic Alison Alter on election day 17,569 to 12,943, coming within just 634 votes of winning the 50% needed to avoid a runoff. But by the time the low-turnout December election came around, Alter won out 9,481 to 5,339. It’s possible there were some voters who changed their minds but more likely development-skeptic voters were just more motivated to turn out in December. Development-skeptic candidate Laura Morrison said her strategy was to force a runoff, where the smaller, more development-skeptical electorate would favor her.
Showing up to vote for the runoff at the same location where you early voted and finding this sucks a little bit. pic.twitter.com/H7rZfcGf2k
— David Whitworth (@dcwatx) December 11, 2018
But while our two-part runoff system means we have some low-turnout ballots, it used to be much worse. Prior to 2014, we elected City Council in May elections rather than November ones. The transition to higher turnout elections has brought out a broader group of voters with a broader set of issues, less animated by opposition to development. This trend could accelerate if Texas, like Maine, adopted instant runoffs, in which voters state their second (and third and fourth, etc) choices at the same time they select their first choice, allowing a runoff without forcing voters to come out twice. However, Ed Espinoza on Twitter tells me it may take a change to state law in order for this to happen:
It was an opinion by then-Secretary of State Henry Cuellar.
— Ed Espinoza (@EdEspinoza) December 13, 2018
2) 10-1 gave more representation to underrepresented populations open to development
Both before and after Austin switched from seven at-large Council Members to ten single-member districts and one at-large mayor, the vast majority of votes in Austin have come from the richer, whiter parts of town. Here, for example, are the total number of voters in each district in the 2014 city council elections, as well as the racial / ethnic group of the Council Members who have represented that district:
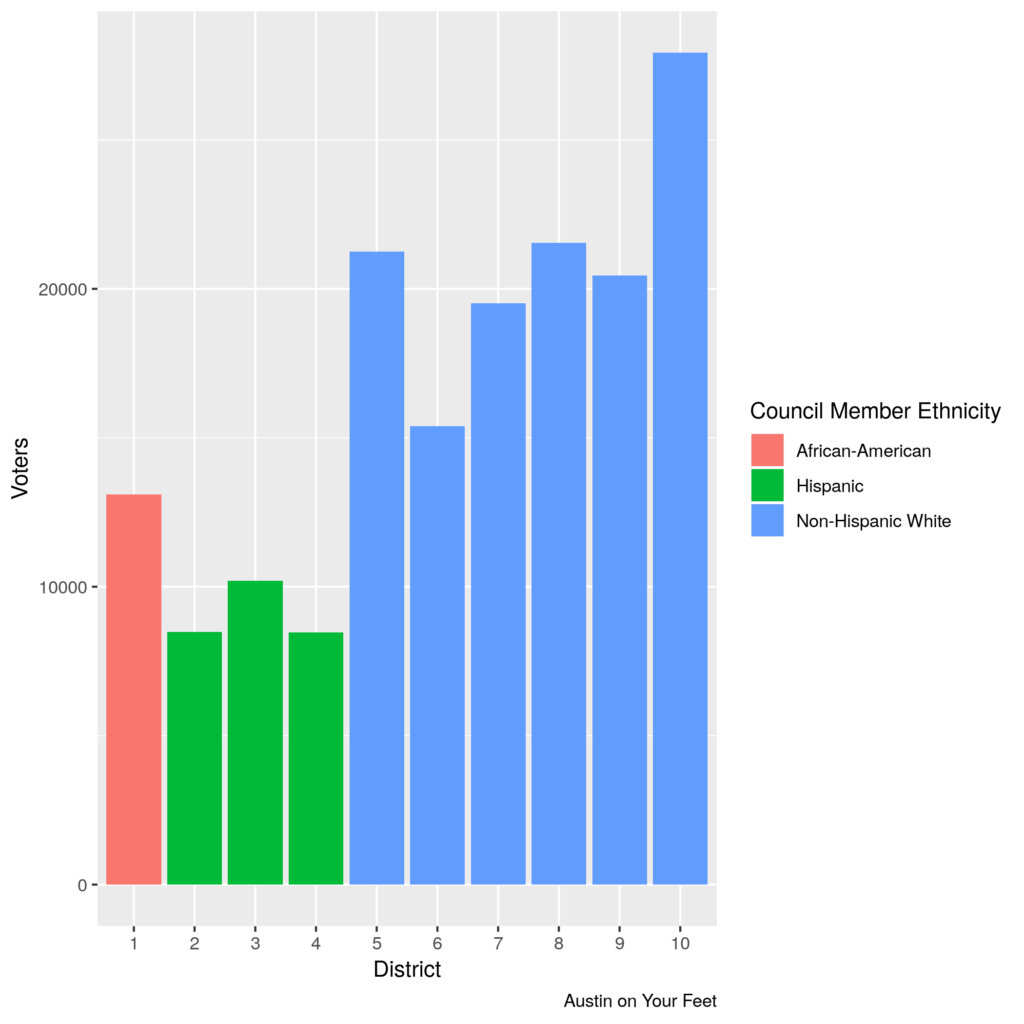
All districts were made to have roughly equal numbers of people living in them. But not all of those people vote! There were more than three times as many votes cast in 2014 in wealthier, whiter District ten than in poorer, more Hispanic Districts two and four. This difference is driven both by the number of eligible voters and by voter participation rates. When all Council Members were elected at large, this meant that the votes of the areas and populations that turn out at lower numbers were diluted among the votes of the areas that turn out at higher numbers. Since 10-1, these areas are represented at a proportion to their populations, not to their voting rates.
Of course, it isn’t a given that “population that votes in great numbers” or “white” are anti-development or “population that votes in lower numbers” or “non-white” are pro-development. Ora Houston of District 1 was a consistent development skeptic, while Jimmy Flannigan of District 6 and Sheri Gallo of District 10 have been more development-friendly. But generally, the electeds and the electorate in the less white districts have proven to be more open to development than the whiter, more voter-rich districts–and this is true in other places outside Austin as well. Indeed, if you look at the five districts with the fewest votes in the 2014 election (one, two, three, four, and six), these districts will be represented by some of the most development-friendly Council Members on Council in 2019.
3) 10-1 created new, geographically based sources of legitimacy
Prior to the 2014 switch to a district-based council, all Council Members were elected by an electorate from across the entire city. When we were considering the switch from at-large Council Members to geographical districts, there was something of a debate on what was likely to happen between two of my friends and fellow bloggers, Chris Bradford of Austin Contrarian, who feared that this would create a system of ward privilege, and Julio Gonzalez of Keep Austin Wonky, who was a bit more sanguine. At the time, I leaned closer to Chris’ argument but so far, Julio’s predictions have turned out to be more accurate. On issues that affect a single council district, Council Members definitely defer to the district Council Member in some ways; often, the Council member whose district is most affected will speak first and longest on a case. On cases where other Council Members don’t have developed opinions, they may choose to vote with the district Council Member. But Council Members have also shown a lot of willingness to vote their consciences.
Indeed, there’s a sense in which geographical districts have actually reduced ward privilege. When the Council was elected at large, they often gave a significant amount of deference on zoning cases to leaders of the nearest neighborhood associations. While neighborhood associations are unelected, they were still often seen as a good pulse of what voters thought in that district. Now, with single-member districts, some neighborhood associations still have a large amount of sway where voters elected a Council Member that agrees with them. But in other Council districts, anti-development forces have had to handle a diminution of their authority as they put their preferred candidates to the electoral test and lost.
Nowhere has this been clearer than District 3, where Pio Renteria has won two straight elections over his sister Susana Almanza. The siblings have been on opposite sides of neighborhood politics for decades; Council Members trying to get the pulse of East Austin sentiment sometimes used extremely imperfect proxies like how many people showed up to debate an issue at City Council. Now, with voters choosing Renteria twice, there is little reason for other Council Members to value Almanza’s voice over Renteria’s.
Where from here?
Politics has a way of going through pendulum swings. It’s possible that norms of ward privilege will emerge over the course of years. It’s possible that I’m overreading the factors above and luck has played a large role in the formation of the Council. After all, the same District 1 that elected development-friendly Natasha Harper-Madison also elected development-skeptic Ora Houston. But it’s also possible that these changes in Austin’s electoral system have led to a real structural shift in politics that could have big implications as Austin becomes closer to a big city.
This blog cut its teeth analyzing Project Connect’s light rail vision in 2014 but I’ve stayed relatively silent on the current iteration of Project Connect. Largely, this was because Project Connect did pretty extensive but not super sexy analysis in their preliminary reports and I didn’t have much to object to in it or add to it. The one time I chimed in was to encourage new CapMetro CEO Randy Clarke to make the easy call that Austin is ready for trains and maybe give a caveat that if new technologies emerge during the process, we can change our mind.
In the six months since I wrote that piece, Hurricane Randy has blown the process in some completely unexpected directions. In a carefully orchestrated Austin Chamber of Commerce conference presentation that more closely resembled a Steve Jobs product reveal than a city hall briefing, Clarke doubled down on new technology, revealing a map with Austin’s highest ridership transit routes labeled “Autonomous Rapid Transit,” a constellation of technologies like machine vision and vehicle-to-vehicle communications that he sees as changing the cost / benefit relationship on steel rails (i.e. trains) vs concrete lanes (i.e. buses or new tech-augmented vehicles). Since this whirlwind presentation, Austin’s transit activism has been scattered in new configurations, with different camps forming largely based on how they feel about the relative merits of tried-and-true trains vs betting on newer, cheaper technology.
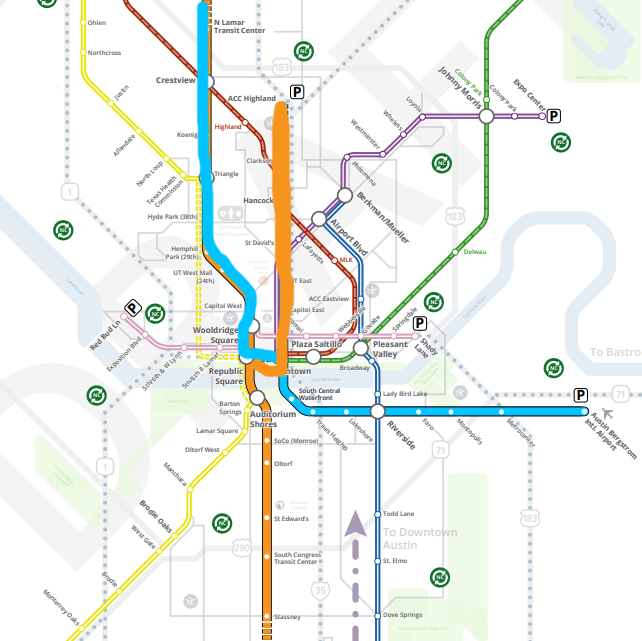
These are very important questions but the thing that really struck me was not the mode but the map itself. Earlier, Project Connect spent $3.5m conducting a corridor study. The study didn’t produce a map of transit lines but what we might call “transit segments,” straight-ish lines where we might consider putting transit. It assessed each segment for how many people would benefit from transit service there and therefore how much transit capacity should be planned for. The result of the study was voluminous documentation on each segment, summarized in this map:
This is not a route map; how the segments fit together into transit lines isn’t specified yet. At the Chamber product rollout, CapMetro revealed their first cut at combining these segments into lines:
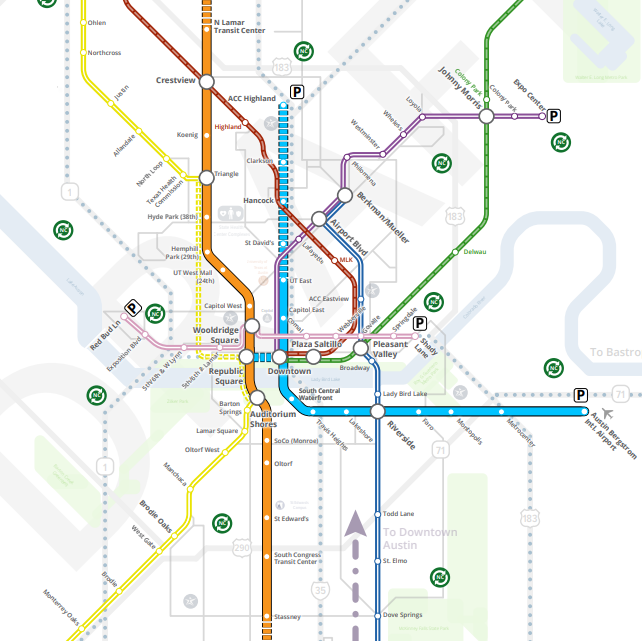
In this map, CapMetro has chosen two high-capacity lines: an Orange Line that connects the highest ridership orange and brown segments, and a Blue Line that connects the highest ridership blue segment with the medium ridership gold section.
A few questions jump out at me when I look at this map:
Why do the high-capacity Blue Line and the high-capacity Orange Line not connect?
These two lines come tantalizingly close to one another! In downtown, they are separated by no more than a few blocks. At the Capitol, they literally have stations named Capitol East and Capitol West. Yet, if you want to transfer from one to the other, you’ll have to walk, even if it’s raining or blistering hot. There’s another way of configuring the lines that adds the possibility of a transfer, for little cost, just by switching up which segment south of the river connects with which segment north of the river:
The next question is: Why did the medium-ridership gold segment get slated for high-capacity service?
Everybody would love high-investment transit service everywhere. But we have limited funds to build and run the system. That’s why we spent $3.5m studying which segments are most useful to invest in. That study found that the gold segment was only a “medium” priority behind not only the three high-ridership segments but also two other segments. So why invest heavily in this gold segment? I don’t know. Maybe even though this segment isn’t a great idea from a ridership perspective, CapMetro think its necessary from a political perspective. If so, they’ve learned nothing from the 2014 referendum when voters rejected this exact segment.
Finally, there’s a related question: Why do we split ridership on our core transit spine into two parallel lines running pretty close to one another?
Austin has a pretty definite spine of population density from north to south. This makes running transit easy because a single line with excellent service can serve a lot of the population. People will walk 5, 10, or maybe 15 minutes to a local bus line, but our central spine is wider than that. So when we build a high-capacity, high-investment service, we hope that it’s going to draw people from a wider area than a local bus line. It’s going to be fast, frequent, unobstructed, and comfortable with expensive things like platforms for level-boarding and off-board payment systems to keep it going fast, as well as politically expensive things like dedicated lanes. As a result, some people will go further to ride. Maybe they’ll walk further, or maybe they’ll bike or scoot to the station, or maybe they’ll get dropped off, or maybe they’ll take a cross-town bus. Because the service is so much better, it’s worth it. A virtuous cycle gets started, where improved service encourages more people to use the service. This happens both from within the normal 10-minute walk zone because the service is more competitive compared to driving or taking a Lyft and from outside the normal 10-minute zone, because the service is more competitive versus taking the local bus.
But the CapMetro plan to split those improvements over two segments running parallel to one another threatens to nip that positive feedback cycle in the bud. For the same costs, some of the vehicles that would be running on the central spine will instead be running on the parallel line. Neither line can run as frequently. In the companion piece to this blog, I’ve gone in more depth on an example. The extra construction costs of running more miles of track (whether steel or concrete) will also mean that we will have to save money somewhere else. What if, instead, we doubled down on a golden mile high-frequency transit spine? It could look something like this:
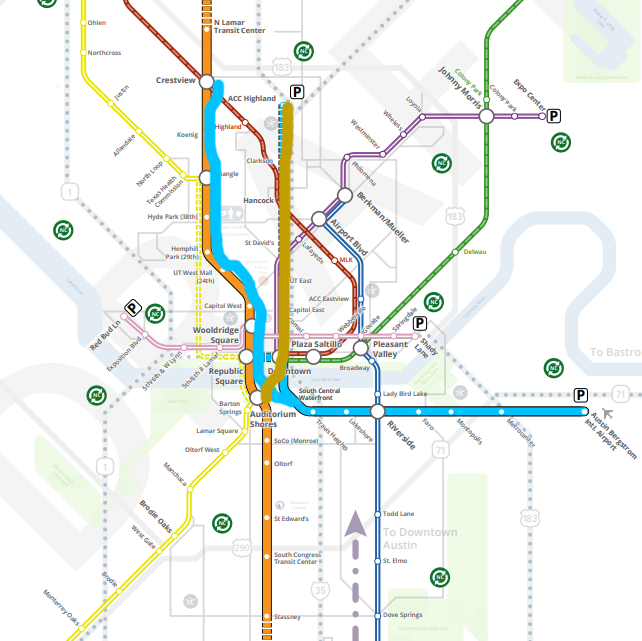
The Blue Line, instead of running parallel to the Orange Line, runs on the same track as the Orange Line up to Crestview. If the Blue Line is running 6 vehicles per hour and the Orange Line is running 6 vehicles per hour, then there will be 12 trains per hour between Crestview and Auditorium Shores — transit service of the likes Austin could only dream about right now. We would have six golden miles of transit-first city from Auditorium Shores to downtown to UT to the Triangle to the state office complex to Crestview. What was the northern segment of the Blue Line instead becomes the Gold Line, a medium-investment line as envisioned in the original Project Connect study. The money saved by not building parallel high-investment lines in the central city could be reallocated by extending the high-investment orange line from North Lamar Transit Center to Rundberg, improving the equity and usefulness of the route.
Is this the One True Austin Transit Map? I mean, I think it’s a pretty damn good one but I hope that our decision is backed by a little more research and analysis than this blog post. What I really hope happens is that the same project team that came up with such an excellent study of the segments is invited back to finish off the job and produce one or two final options for routes. CapMetro says that this isn’t the end, it’s the beginning and they’re open to changes. I hope that’s the case because this map needs more than a couple tweaks.
I don’t drive. When I arrived in Austin, I learned this was a hard city to get around in without driving but I didn’t know exactly why. This search to understand what makes Austin so hard to get around without a car is what got me all mixed up in this world of blogging and advocacy. I still don’t have all the answers today but I’d like to share some of what I’ve learned on one specific topic: what makes for great public transportation.
Not every one needs to go to the same place. So the best public transportation doesn’t go absolutely everywhere, but it does go to places many people need to go: places where oodles of people live nearby or oodles of people work or shop or visit or ideally places where oodles of people do all of these things. In different places and social circles, public transportation has a reputation as being only for poor people or only for rich people, but the best public transportation isn’t limited to only poorer areas or richer areas.
The Polar Express winds through large buildings on either side. via GIPHY
Great transit isn’t like taking a taxi. You can’t expect it to carry you straight to the door of where you want to go. This means that when you get to your stop, you have to have a safe, comfortable, accessible way of walking (or using your wheelchair or scooting or biking) the rest of the way to your final destination. Bonus points if there’s easy bike or scooter shares right at the transit stop for you to take the rest of the way. Extra bonus points if you can pay for both with the same fare payment system. Connecting transit to cars by putting parking lots at transit stops or transit stops next to a highway usually makes transit worse not better. Cars take up a lot of room, they’re loud and emit noxious gases and they hurt a lot if they hit you.
The best stop spacing for a route depends on the rest of the services offered. For example, trains running underground will be better off with larger stop spacing, for the most part, than a bus running in mixed traffic. Walking long distances to a station is more acceptable when the payoff is a fast and reliable ride once you get there!
Great public transportation connects great places in logical and straightforward ways. A single bus line could hit every great place in a city but if it takes you hours to wind through the city, that’s not very useful.
Great public transportation doesn’t get caught in traffic. A vehicle filled with 30, 130, or 300 people should never be made to wait behind lines of vehicles with 1 or 2 people in them. That means it needs its own transit-exclusive lanes that individual vehicles can’t use. Transit-priority lanes (e.g. lanes that non-transit vehicles can only use if they’re turning) are better than buses or trains running in normal traffic but still way worse than transit-exclusive lanes.
Getting stuck behind a car isn’t the only way to slow a bus or train down; you can also get stuck waiting for cars to clear an intersection. That’s why the best public transportation runs either below-ground or above-ground. If public transportation vehicles and private cars are both running on the ground, a second-best solution is to give transit vehicles “signal priority” — the ability to turn lights in front of them green before they get to the intersection.
Time waiting for the ride to start is time wasted. Looking at timetables is an annoying hassle. The best service is the one you can just show up for, secure in the knowledge that there’s a vehicle coming for you soon.
Having said that, it’s still useful to know when the next vehicle is coming. Signs in the station, apps, and APIs for third-party apps should all have real-time updates on when the next vehicle is coming through.
Transit shouldn’t take forever to load and unload. One way to speed up boarding is to provide platforms, so that stepping (or even more so, rolling your wheelchair) on to and off of the bus or train can happen quickly. Another way to speed things up is to have people pay while they wait at the stop or station, rather than as they board. This can be done many different ways, like turnstiles that control access to a station or ticket-vending machines providing receipts that randomly get checked. Imagine how much less useful an airport tram would be if every passenger had to board one at a time and pay at the front!
This is almost too obvious to mention yet many transit agencies don’t even provide the bare minimum. At the end of a long work day, the last thing anybody wants to do is wait in the rain or the blistering heat or sometimes even stand up longer than they have to.
Comfort doesn’t stop once you get on the vehicle. One big difference-maker is how smooth the ride is. Trains generally offer a smoother ride than buses, which depend more on both the quality of the vehicle and the quality of the road. Another difference-maker is engine noise. In this aspect, electric vehicles are better than diesel ones, which again is an advantage more trains have over most buses.
Some bus rides are magical in all the wrong ways.
Almost every aspect described above costs something. Building shelters and platforms is more expensive than putting up bus stop signs. Ticket vending machines cost money to install and operate. Building subways is more expensive than running trains at street level. The art of making good transit is figuring out which of the items are essential for the service you’re running and which can be sacrificed. But there are also some more general principles toward keeping transit cost-effective.
While there’s no sense deliberately running an overly large vehicle, almost all of the operations costs of running a bus is paying the driver. Running an empty bus costs a similar amount of money whether it’s a large bus or a small bus. Small buses is everybody’s favorite naive solution to saving money on transit, but often the extra operations costs of maintaining more types of vehicles actually makes this more expensive. But costs can really pile up when your vehicles aren’t large enough. Running 30 vehicles an hour with 40 passengers per vehicle is much more expensive than running 10 vehicles per hour with 120 passengers per vehicle. Classically, this has been one of the key tradeoffs of buses vs trains. Trains cost much more to install but their greater capacity per operator can yield lower recurring costs for high-ridership lines.
A few months ago, Austin revamped its bus system, making a sweep of changes to routes known as CapRemap. The new system made a number of bus routes run more often, at the expense of longer walks to some bus stops, more transfers required, and some infrequently used routes being rerouted altogether. How has it been going? CapMetro employees say that a thorough analysis will require at least six months of data but I decided to take a sneak peek because we’re impatient and because I want a chance to gain some context about what CapMetro is, does, and how it got to here.
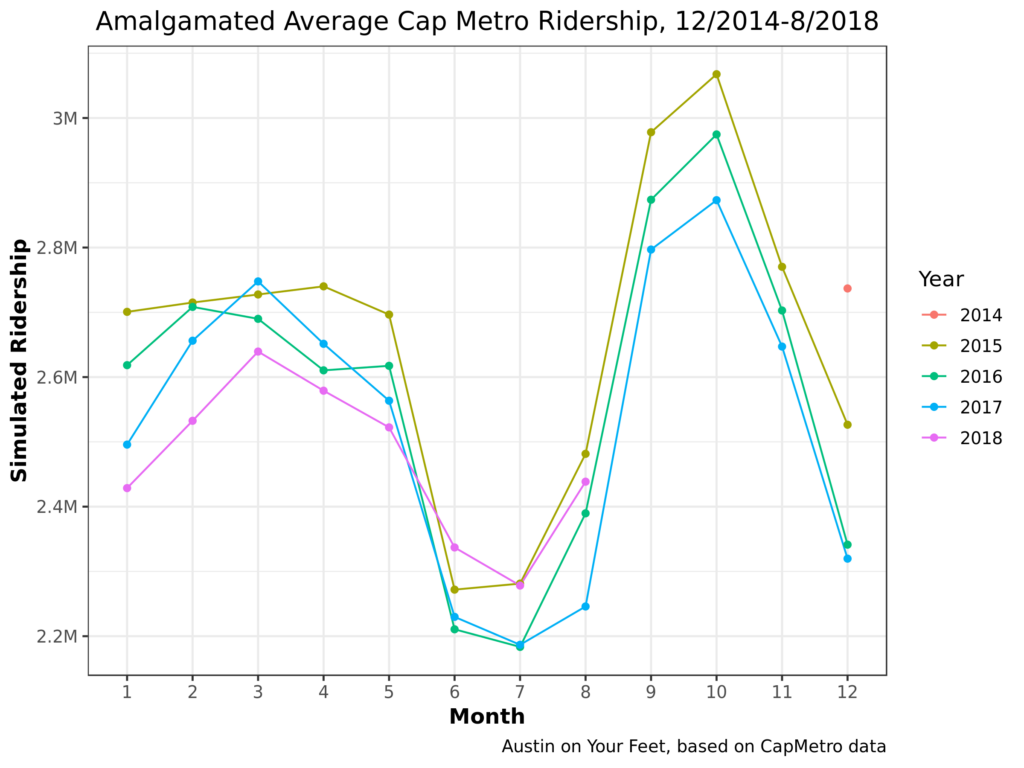
So let’s start! Early returns look positive. Very positive. Each line in this chart represents one year. 2014 only has one data point (December), so it doesn’t get a full line; just a single dot. And of course, I only have data through August for 2018.
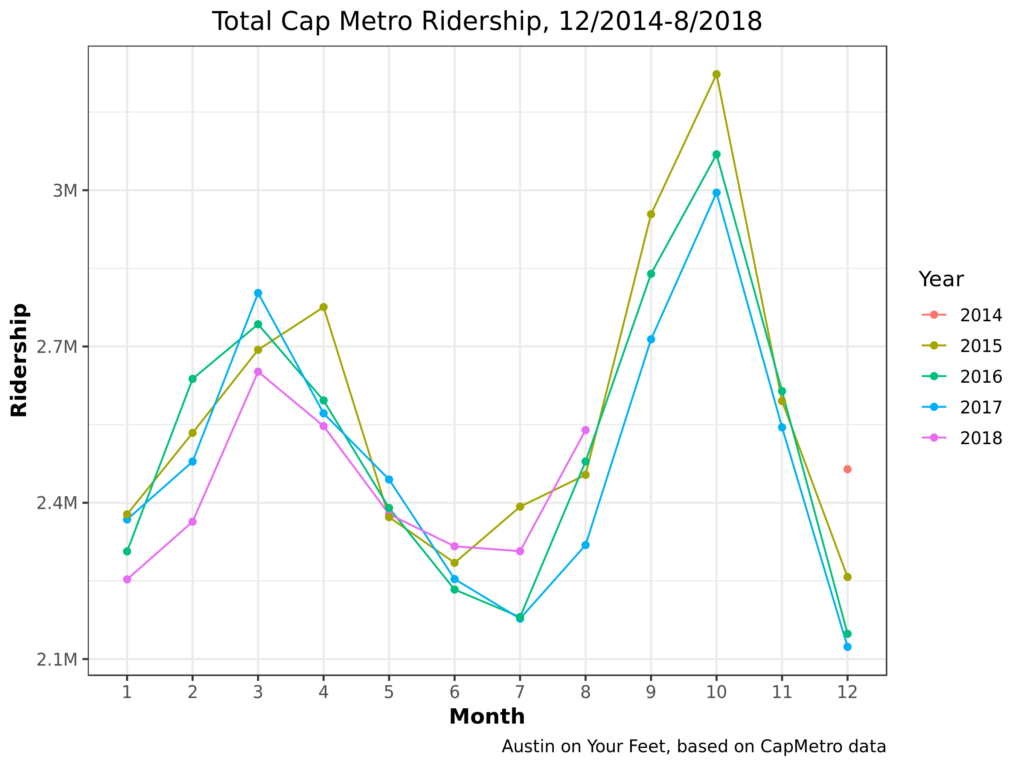
To assess CapRemap, look at the purple 2018 line. For the first five months of 2018 (pre-Remap), it hugged the bottom. CapMetro carried fewer riders in January 2018 than January 2017, 2016, or 2015. Same for Februrary, March, and April. Almost the same for May. Starting in June, when CapRemap went into effect, CapMetro mostly reversed the trend, carrying more riders in each month in 2018 than in the previous few years. There are good reasons to not celebrate yet. June, July, and August are low-ridership months for CapMetro, so CapRemap hasn’t been tested in the busy season.
So let’s look a little bit harder at some background information, so we know what to look for as we continue to evaluate CapRemap’s performance in upcoming months.
Some things that jump out to me:
1. CapMetro Ridership is highly seasonal! In addition to the summer lull discussed above, there’s a December lull (probably, again, because students and others take time off from work). There are also spikes in March and October, the two major festival seasons.
2. Until Cap Remap, ridership has been trending down each year. The highest ridership December was in 2014, with each successive December having lower ridership. 2015 was the highest ridership complete year, with 2016 and 2017 far behind. Before Cap Remap, 2018 was the lowest ridership of the lot. Cap Remap may have reversed this trend, but three months may not be enough to tell.
Let’s break these numbers down another way. Instead of breaking out years by month, let’s break them out by what type of service people rode: bus (local, express, or rapid), UT shuttle, train (MetroRail), Special Event, or paratransit (MetroAccess). This chart only shows the three years I have complete information on:
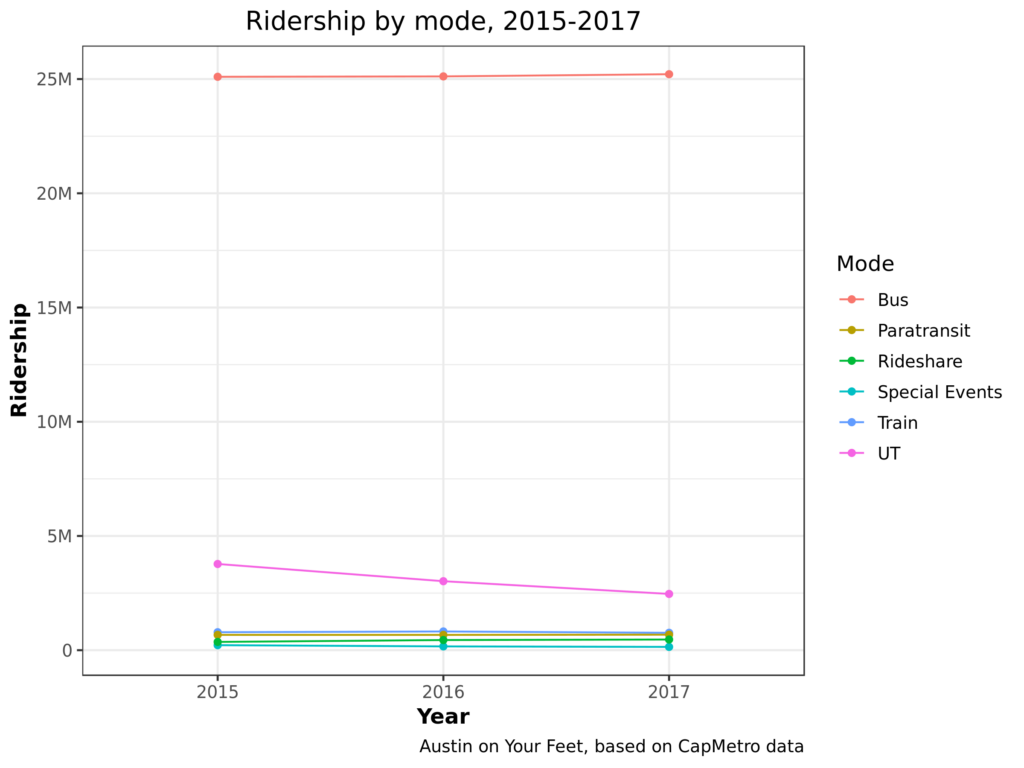
What do we learn?
Let’s filter out the non-UT buses so we can see the rest of the categories better.
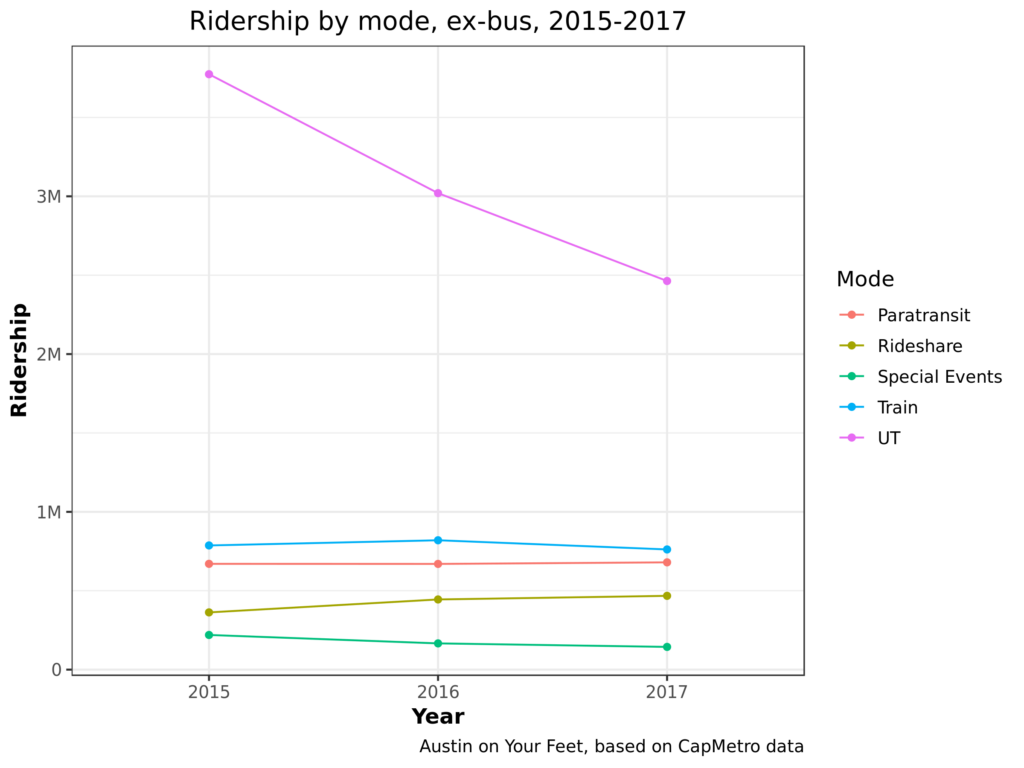
Again, the major plot point here is that UT shuttle ridership is plummeting. I’ve heard four theories why:
How much do each of these hypotheses explain the ridership drop, if at all? That’s beyond the scope of this blog post. But just to confirm that this is an ongoing trend, here’s a picture of ridership of the UT shuttle on its own:
s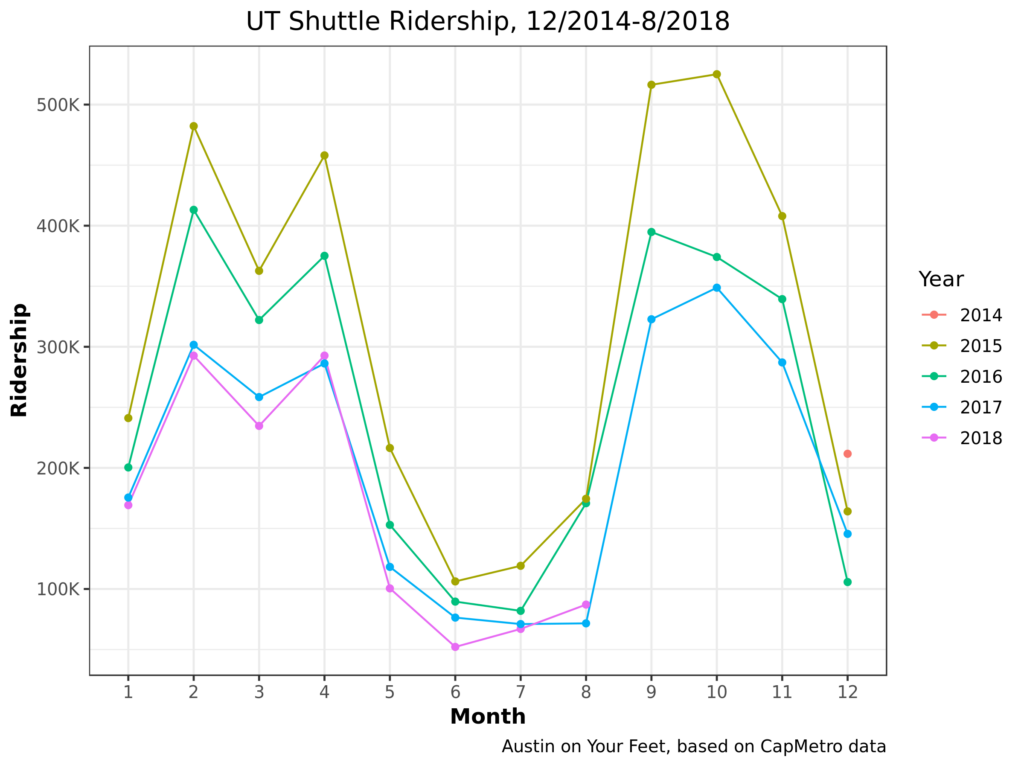
Yup, 2018 has continued that trend. Even the August number’s relative resurgence is probably more of a blip than a comeback, as August 2018 had more shuttle service days than 2017. Okay, we’ve looked at shuttle ridership enough. What happens if we look at total ridership again, but this time we look at all ridership except UT shuttles?
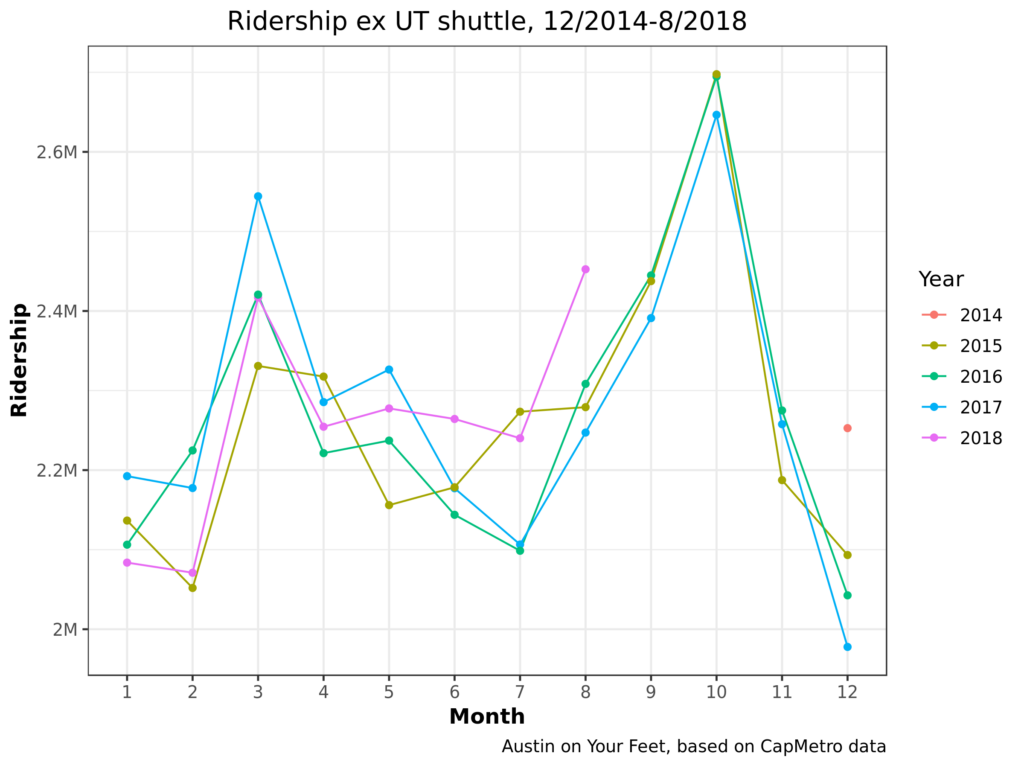
This changes things! 2017 goes from being the second-worst year to one of the best. Comparing this chart with the first, we can see the majority of CapMetro’s recent ridership losses have been from the UT shuttle. There’s a similar story to show regarding special event (mostly festival) service, which has also been declining in the last few years.
There are different ways of looking at this. On the one hand, we can say that CapMetro has actually been far more stable than some people (myself included) have given it credit for over the last few years. While nobody should feel satisfied with Austin’s levels of transit ridership, most classes of passengers aren’t leaving bus service even in drips and drabs.
On the other hand, UT students should be some of the easiest students to serve! They have less money to drive cars, they pay literally nothing for each bus ride they take (UT pays CapMetro a lump sum), they live in dense neighborhoods and travel to dense job / academic centers. CapMetro and UT have made some changes to this service over the last few years and ridership has dropped sharply! Did these changes cause the ridership drop? Were they worth it? If ridership is changing because more and more students live in West Campus, is it not time to look at improving service in West Campus? These questions haven’t got nearly the public hearing that they ought to have considering how dramatically UT shuttle service has declined.
I hope to make these charts a regular feature as new data is released. I will update some of the core charts above, enhance some of them with some more nuanced analytical techniques, as well as supplementing them with new charts to explain any interesting features we see in the data. Are there questions you’d like to see answered? What do you see in today’s charts? Let us know in the comments!
9/26 Update!
I have added some charts but it didn’t seem worth a new post.
[Editor’s note: these slides got lost in a server move. 🙁 ]
Something jumps out here! Sunday ridership is way, way up since CapRemap! This isn’t surprising as CapRemap increased Sunday frequencies. When the bus runs more often, people ride it more.
Finally, I’ve put together a bit of a more abstract chart. Two reasons why the other charts bounce up and down from month to month and year to year is that each month has a different number of days in it, and then even beyond that, each month has a different number of weekdays and weekends in it from year to year, depending on where it falls on the calendar. So I’ve created a notion of a composite month, which always contains 30 days, and which 1/7 of the days are always Sundays. This leads to a chart in which, instead of seeing ebbs and flows of which month has more weekdays in it from year-to-year, the ebbs and flows of ridership are based more strictly on how many people chose to ride the bus.
Nothing earthshaking here but that’s kind of the point. It’s smoothed out some of the jaggedness caused by February only having 28 days, or an August that has fewer weekdays than normal.